Code
Rmarkdown is a powerful tool for combining code, text, and visualizations in a single document. It allows you to create documents that are reproducible, dynamic, and interactive.
There’s a ton of stuff to learn with rmarkdown. Get inspiration here
Rmarkdown documents have 3 basic ingredients
Quarto is the new cool kid in town.
For all intends and purposes, quarto and rmarkdown are practically interchangeable. Rmarkdown will not be deprecated, but Quarto is likely to see more development in the future than rmarkdown.
Right now, rmarkdown has a bit more user friendliness within RStudio (clearing knitr cache, and setting knitr working directory), but quarto has nicer defaults regarding outputs.
If you’ve never used rmarkdown, it’s probably a good idea to start with quarto. I will use Quarto going forward. But it’s totally fine for you to continue with rmarkdown.
See also the FAQ from posit
-> open example_rmd_file.Rmd and example_rmd_file.html in example_rmd folder
example_quarto.qmd and example_quarto.html in example_quarto folder# is used to define headlines- creates an unordered list1. creates ordererd lists*one asterisk* makes text italics**two asterisks** makes text bold<html> tags if you prefer (e.g. I often use <br> to add a line break)For more, see this markdown guide
Tip
Html Documents allow you to use tabs to let viewers compare different types of things.
I love this feature to contrast and compare plots or models that rely on similar but different data, e.g. subsamples, or robustness checks.
For .rmd documents you can use tabs by writing {.tabset} after a heading. Then, the next sub-headings after this will be tabbed (see next slide).
# My Heading {.tabset}
## This is tab 1
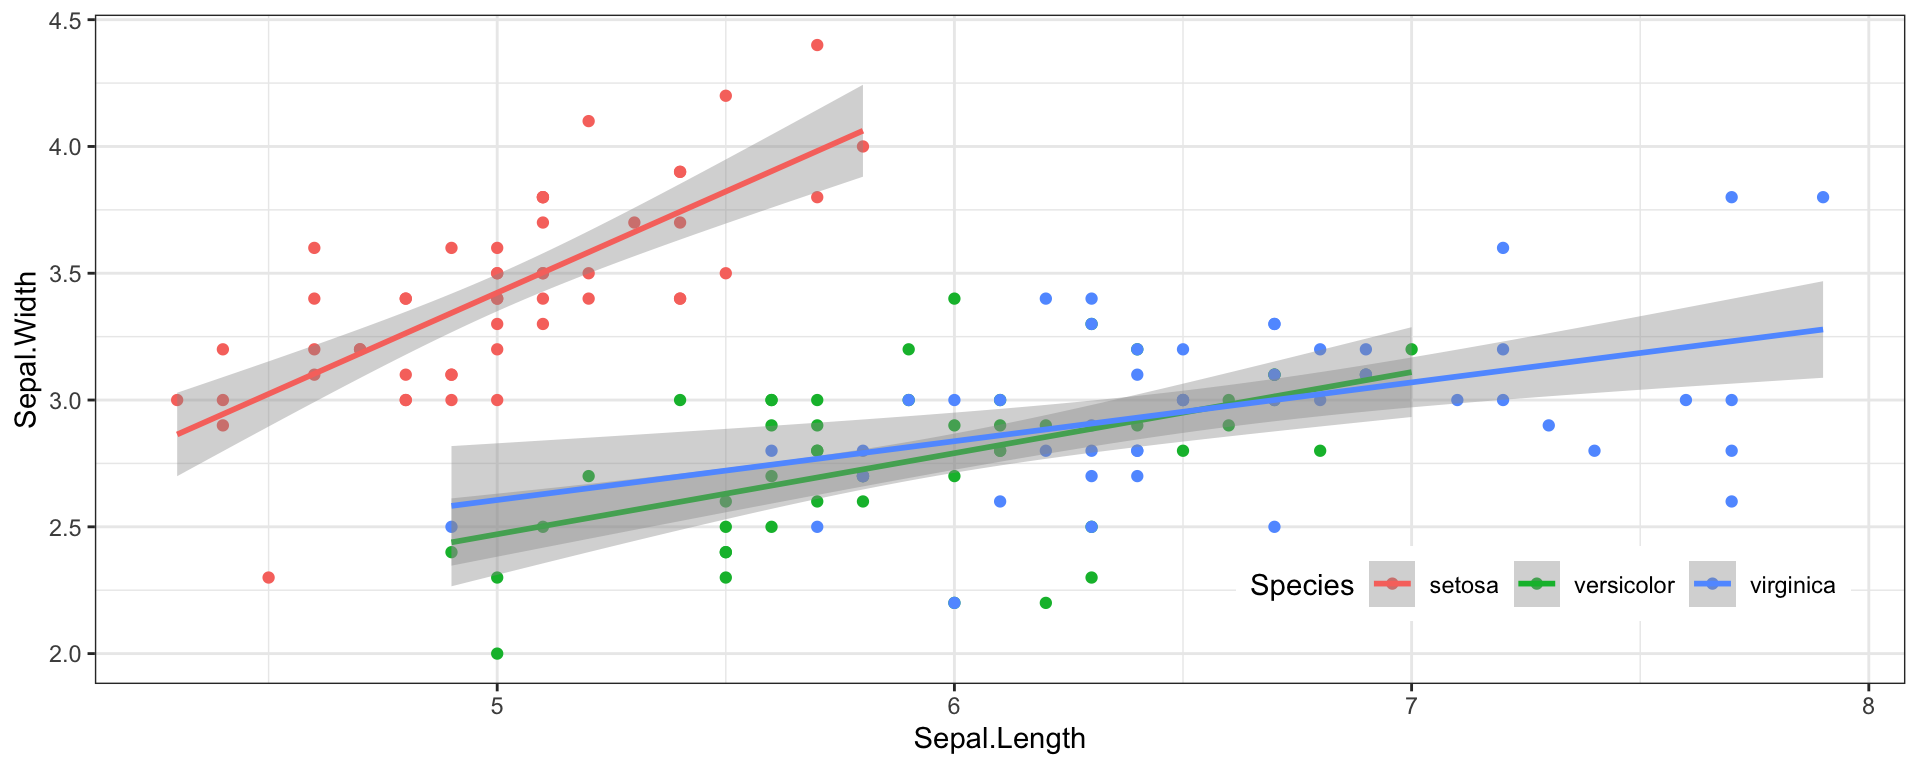
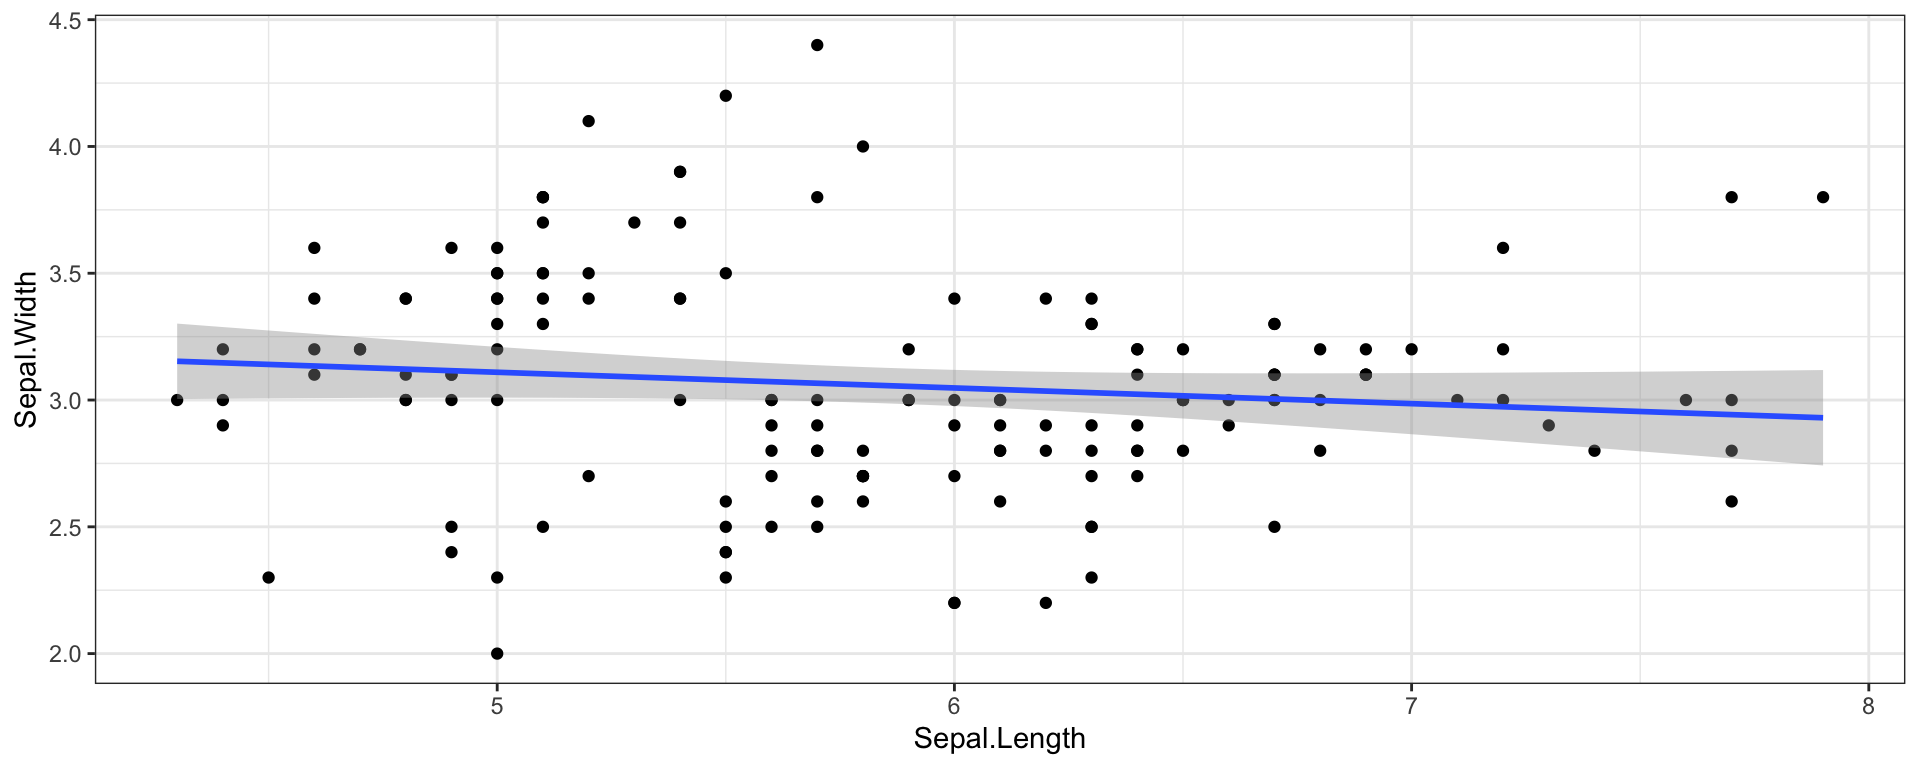
iris %>%
  ggplot(aes(Sepal.Length, Sepal.Width)) +
  geom_point() +
  geom_smooth(method = "lm") +
  theme_bw()
## This is tab 2
---
title: "Title..."
author: "--redacted for anonymous peer review--"
date: "date"
output:
  html_document:
    toc: true
    toc_float:
      collapsed: true
    toc_depth: 4
    theme: flatly
    code_folding: show
    number_sections: false
    keep_md: yes
    df_print: paged
editor_options:
  chunk_output_type: console
---
```{=html}
<style type="text/css">
.main-container {
max-width: 1400px !important;
width: 1400px !important;
margin-left: auto;
margin-right: auto;
}
body {
font-size: 14pt;
max-width: 1400px !important;
width: 1400px;
}
p {
padding-bottom: 12px;
padding-top: 12px;
line-height: 1.15em;
}
</style>
```Tip: save your favorite rmarkdown format as a template
Saving your go-to approach as a template helps you be more consistent and faster.
See here for a guide on how to set things up :)
Bonus experience: doing this will let you create your own first (?) package!
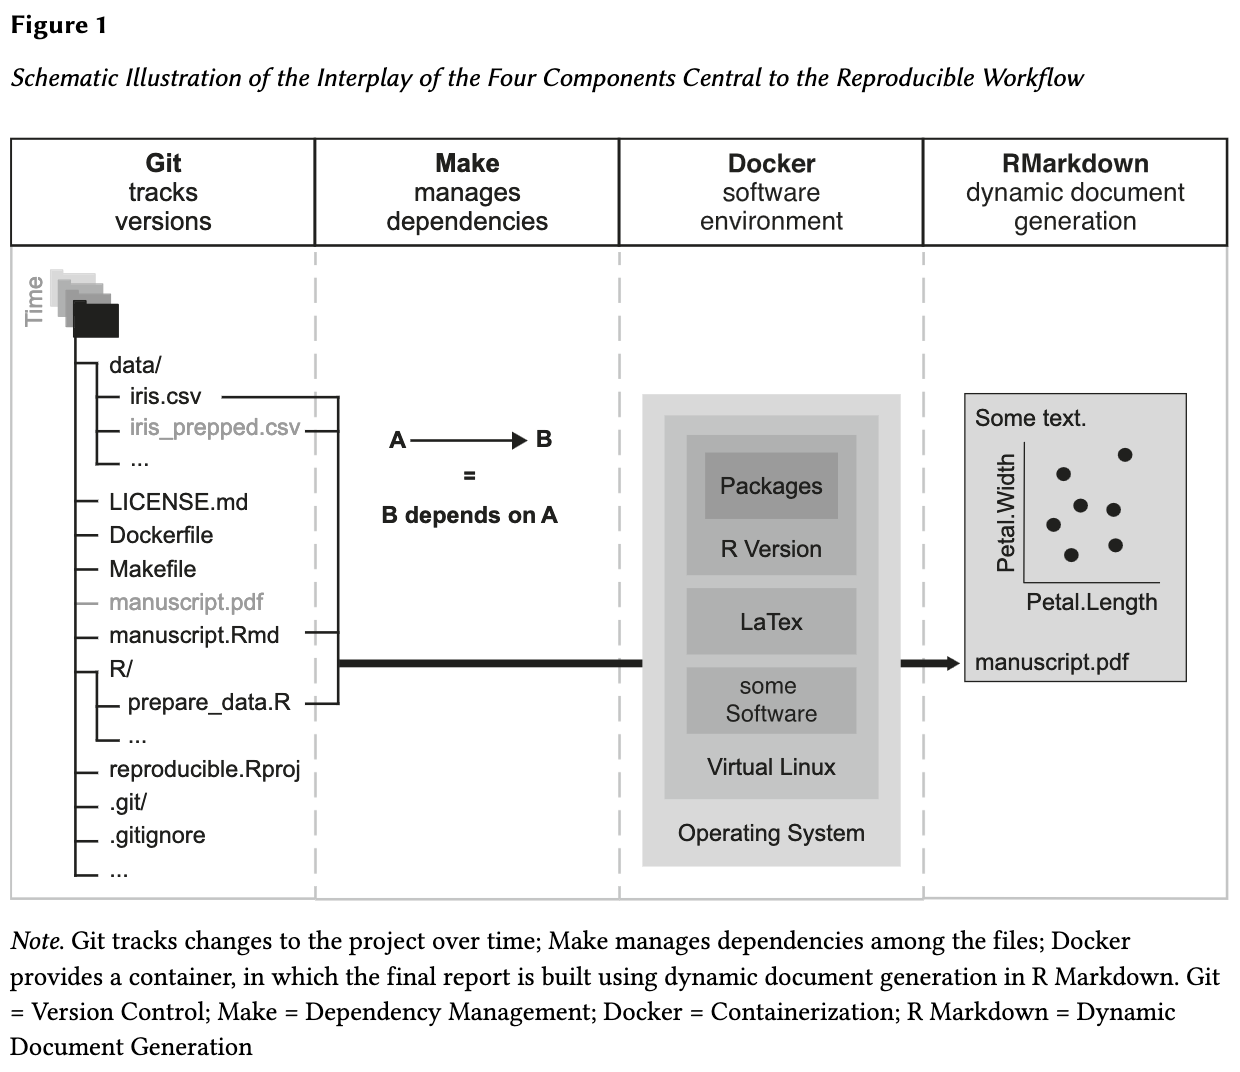
How can we ensure that the work we’re doing is computationally reproducible in 5 years?
set.seed()This function sets a seed that lets you reproduce random outcomes.
set.seed()
sessionInfo()–> prints information about your R session.
R version 4.3.0 (2023-04-21)
Platform: aarch64-apple-darwin20 (64-bit)
Running under: macOS Ventura 13.4

Matrix products: default
BLAS:   /Library/Frameworks/R.framework/Versions/4.3-arm64/Resources/lib/libRblas.0.dylib
LAPACK: /Library/Frameworks/R.framework/Versions/4.3-arm64/Resources/lib/libRlapack.dylib;  LAPACK version 3.11.0

locale:
[1] en_US.UTF-8/en_US.UTF-8/en_US.UTF-8/C/en_US.UTF-8/en_US.UTF-8

time zone: Europe/Copenhagen
tzcode source: internal

attached base packages:
[1] stats     graphics  grDevices utils     datasets  methods   base

other attached packages:
 [1] lubridate_1.9.2 forcats_1.0.0   stringr_1.5.0   dplyr_1.1.2
 [5] purrr_1.0.1     readr_2.1.4     tidyr_1.3.0     tibble_3.2.1
 [9] ggplot2_3.4.2   tidyverse_2.0.0

loaded via a namespace (and not attached):
 [1] Matrix_1.5-4     gtable_0.3.3     jsonlite_1.8.4   compiler_4.3.0
 [5] tidyselect_1.2.0 splines_4.3.0    scales_1.2.1     yaml_2.3.7
 [9] fastmap_1.1.1    lattice_0.21-8   R6_2.5.1         labeling_0.4.2
[13] generics_0.1.3   knitr_1.42       munsell_0.5.0    pillar_1.9.0
[17] tzdb_0.4.0       rlang_1.1.1      utf8_1.2.3       stringi_1.7.12
[21] xfun_0.39        timechange_0.2.0 cli_3.6.1        mgcv_1.8-42
[25] withr_2.5.0      magrittr_2.0.3   digest_0.6.31    grid_4.3.0
[29] rstudioapi_0.14  hms_1.1.3        nlme_3.1-162     lifecycle_1.0.3
[33] vctrs_0.6.2      evaluate_0.21    glue_1.6.2       farver_2.1.1
[37] fansi_1.0.4      colorspace_2.1-0 rmarkdown_2.21   tools_4.3.0
[41] pkgconfig_2.0.3 htmltools_0.5.5 The {renv} package allows you to save a snapshot of your packages used, and track versions of packages
(this is the former {packrat} package)
Documentation: https://rstudio.github.io/renv/articles/renv.html#workflow
Call renv::init() to initialize a new project-local environment with a private R library
Work in the project as normal, installing and removing new R packages as they are needed in the project
Call renv::snapshot() to save the state of the project library to the lockfile (called renv.lock)
Continue working on your project, installing and updating R packages as needed
Call renv::snapshot() again to save the state of your project library if your attempts to update R packages were successful, or call renv::restore() to revert to the previous state as encoded in the lockfile if your attempts to update packages introduced some new problems.