chocolate <- readr::read_csv('https://raw.githubusercontent.com/rfordatascience/tidytuesday/master/data/2022/2022-01-18/chocolate.csv')

head(chocolate) %>% DT::datatable(class = "pagedtable-not-empty")Advanced Tidyverse Tips & Tricks
Tidy data principles
What is tidy data?
Tidy data is a standard way of mapping the meaning of a dataset to its structure. A dataset is messy or tidy depending on how rows, columns and tables are matched up with observations, variables and types. In tidy data:
Every column is a variable.
Every row is an observation.
Every cell is a single value.
Non-Tidy data example
This data is non-tidy because different observations are encoded in the same column (e.g. the ingredients).
Non-Tidy data example (.cont)
Tidy data example (.cont)
Into the tidyverse
Tidyselection
Tidy selection helps you select the columns you want for many different operations in smart ways.
contains()starts_with()ends_with()everything()last_col()
Tidyselection example
Tidyselection
Column selection based on characater vectors
all_of()any_of()
Renaming columns while selecting
A neat trick is to rename a column when selecting it
Reordering columns while selecting
A quick aside: Reordering
Although you can reorder columns using select(), if you only want to reorder things, the relocate() function works better.
Across()
Across()
Across allows you to do things (mutate/summarise/…) to multiple columns at the same time. You can combine this with tidyselection helpers :)
Across()
You can also select columns based on other criteria, when combined with where()
Across()
You can also specify multiple functions to do multiple things at once.
What about additional function arguments?
Provide an anonymous function, using the purrr style lambda ~, or the shorthand \(x)
Rowwise()
The rowwise() function is a convenient way to group a dataframe by row, to do something for which a vectorised function does not exist.
Rowwise()
You can also use selection helpers using the c_across() function.
Exploring the wider tidyverse
Working with factors using the {forcats} package
the fct_ family helps dealing with factor variables, e.g.
fct_reorder()fct_recode()fct_relevel()fct_collapse()fct_lump()- … (not always the most helpful naming conventions, but good documentation)
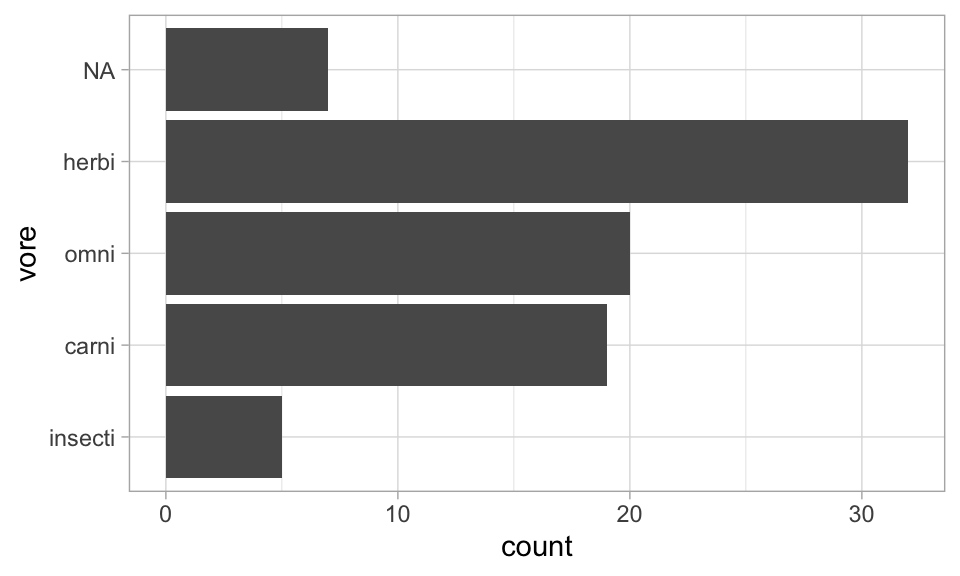
Ordering columns in ggplot using fct_infreq()
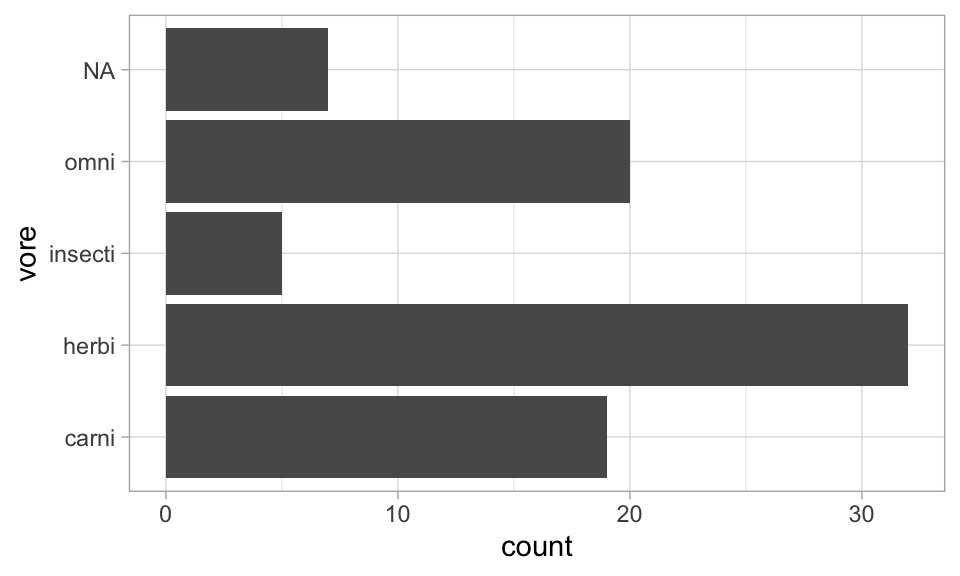
Ordering columns in ggplot using fct_infreq()
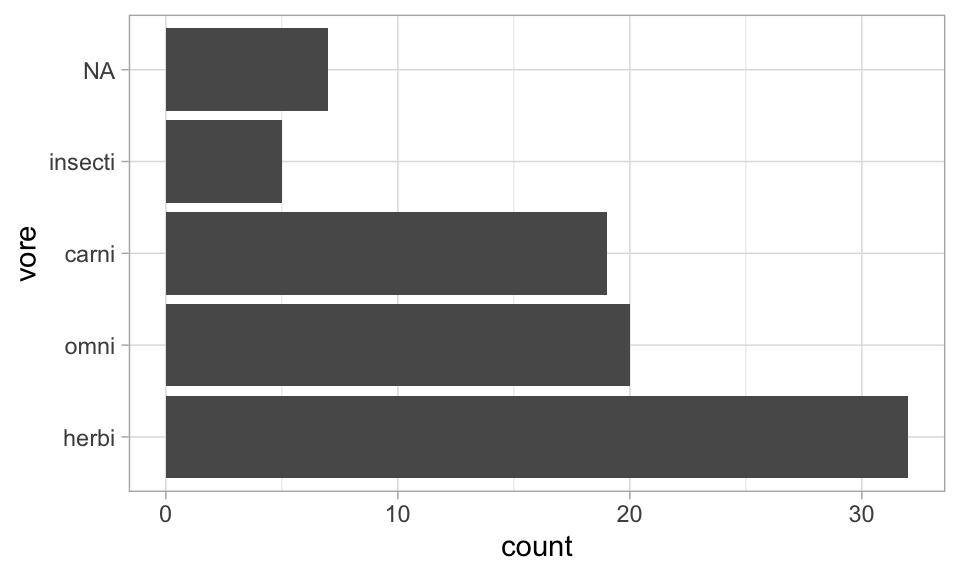
Ordering columns in ggplot using fct_infreq()
case_when()
When using one ifelse() is not enough.
Dates, time, and the {lubridate} package
The {lubridate} package provides super easy ways to detect and convert date variables into any format imaginable.
If you are working with data that has date/time information, you should work with lubridate.
See the introduction to lubridate to get started.
Strings using the stringr package
We’ll come to that in the regex section later today.
Tidying your models with broom broom::tidy()
The {broom} package has great functions for creating tidy dataframes for almost all models out there!
See the introduction to broom to get started
broom::tidy()
Call:
lm(formula = mpg ~ wt, data = mtcars)

Coefficients:
(Intercept)           wt
     37.285       -5.344
Call:
lm(formula = mpg ~ wt, data = mtcars)

Residuals:
    Min      1Q  Median      3Q     Max
-4.5432 -2.3647 -0.1252  1.4096  6.8727

Coefficients:
            Estimate Std. Error t value Pr(>|t|)
(Intercept)  37.2851     1.8776  19.858  < 2e-16 ***
wt           -5.3445     0.5591  -9.559 1.29e-10 ***
---
Signif. codes:  0 '***' 0.001 '**' 0.01 '*' 0.05 '.' 0.1 ' ' 1

Residual standard error: 3.046 on 30 degrees of freedom
Multiple R-squared:  0.7528,    Adjusted R-squared:  0.7446
F-statistic: 91.38 on 1 and 30 DF,  p-value: 1.294e-10