Day 3 - Practical Session

Pick one

Plot your own data
  • plot your data in nice ways
  • play with different themes
  • try to combine plots using the {patchwork} package
Recreate the plot challenge

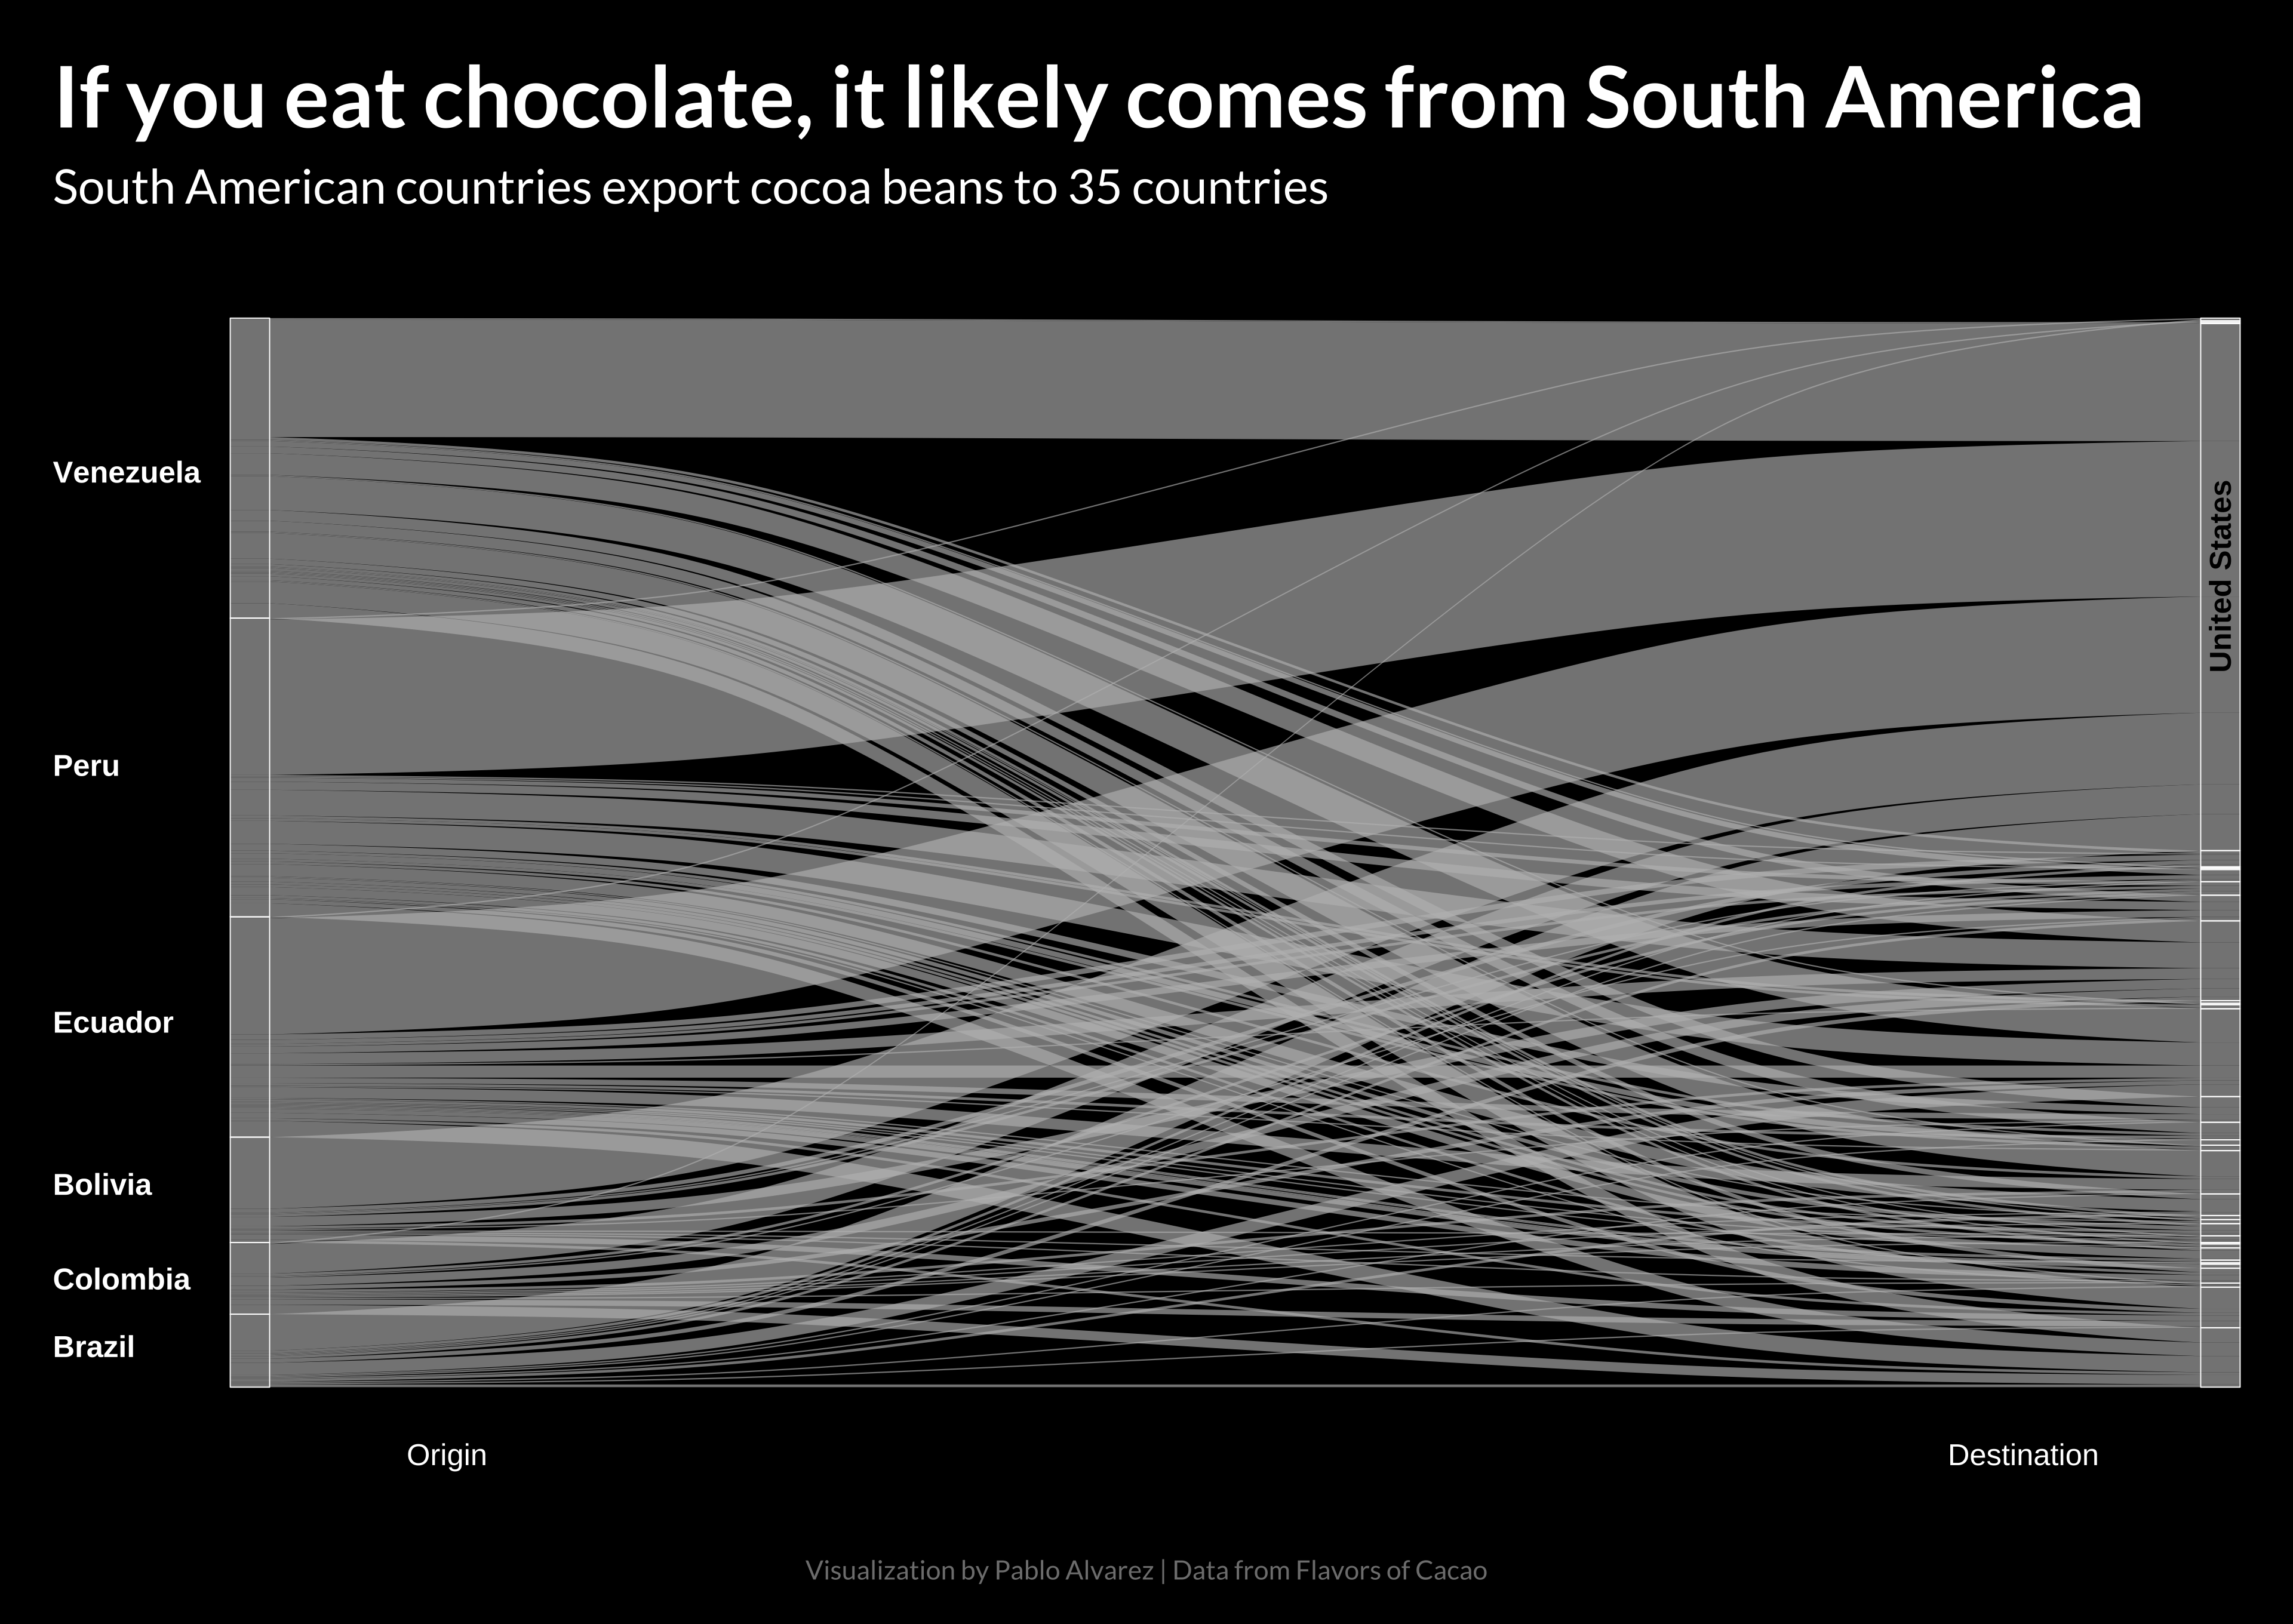
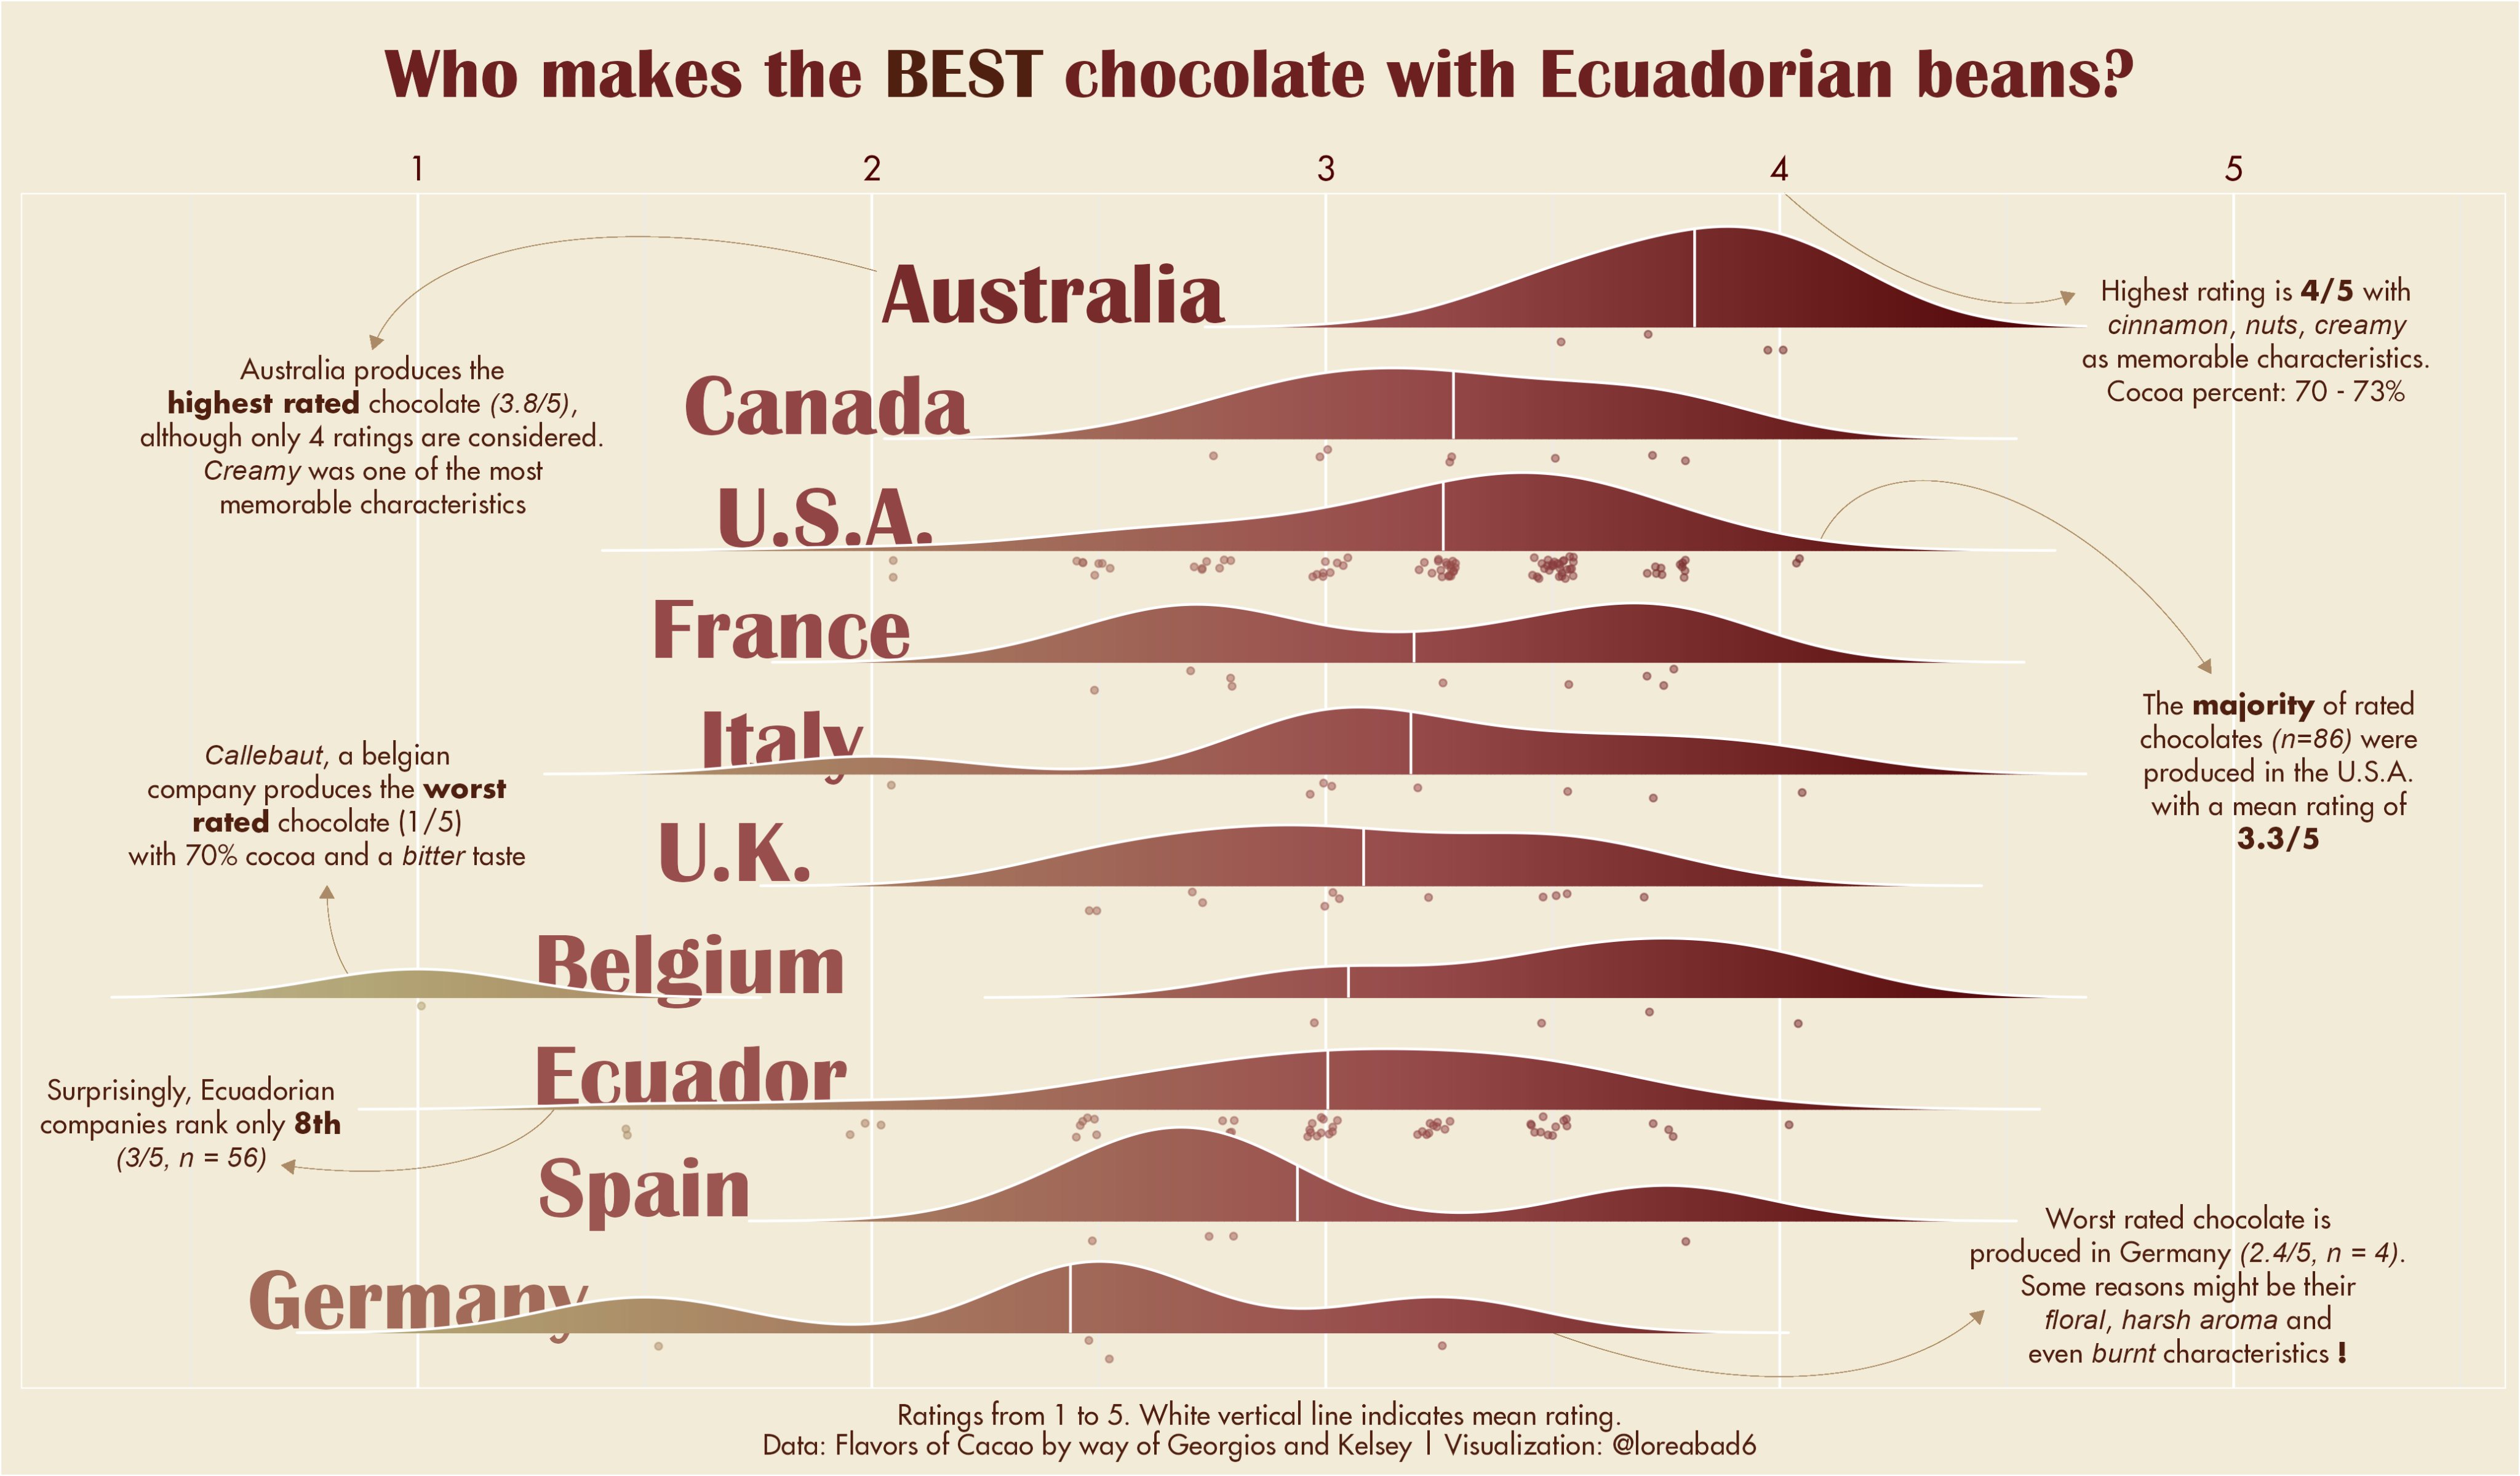
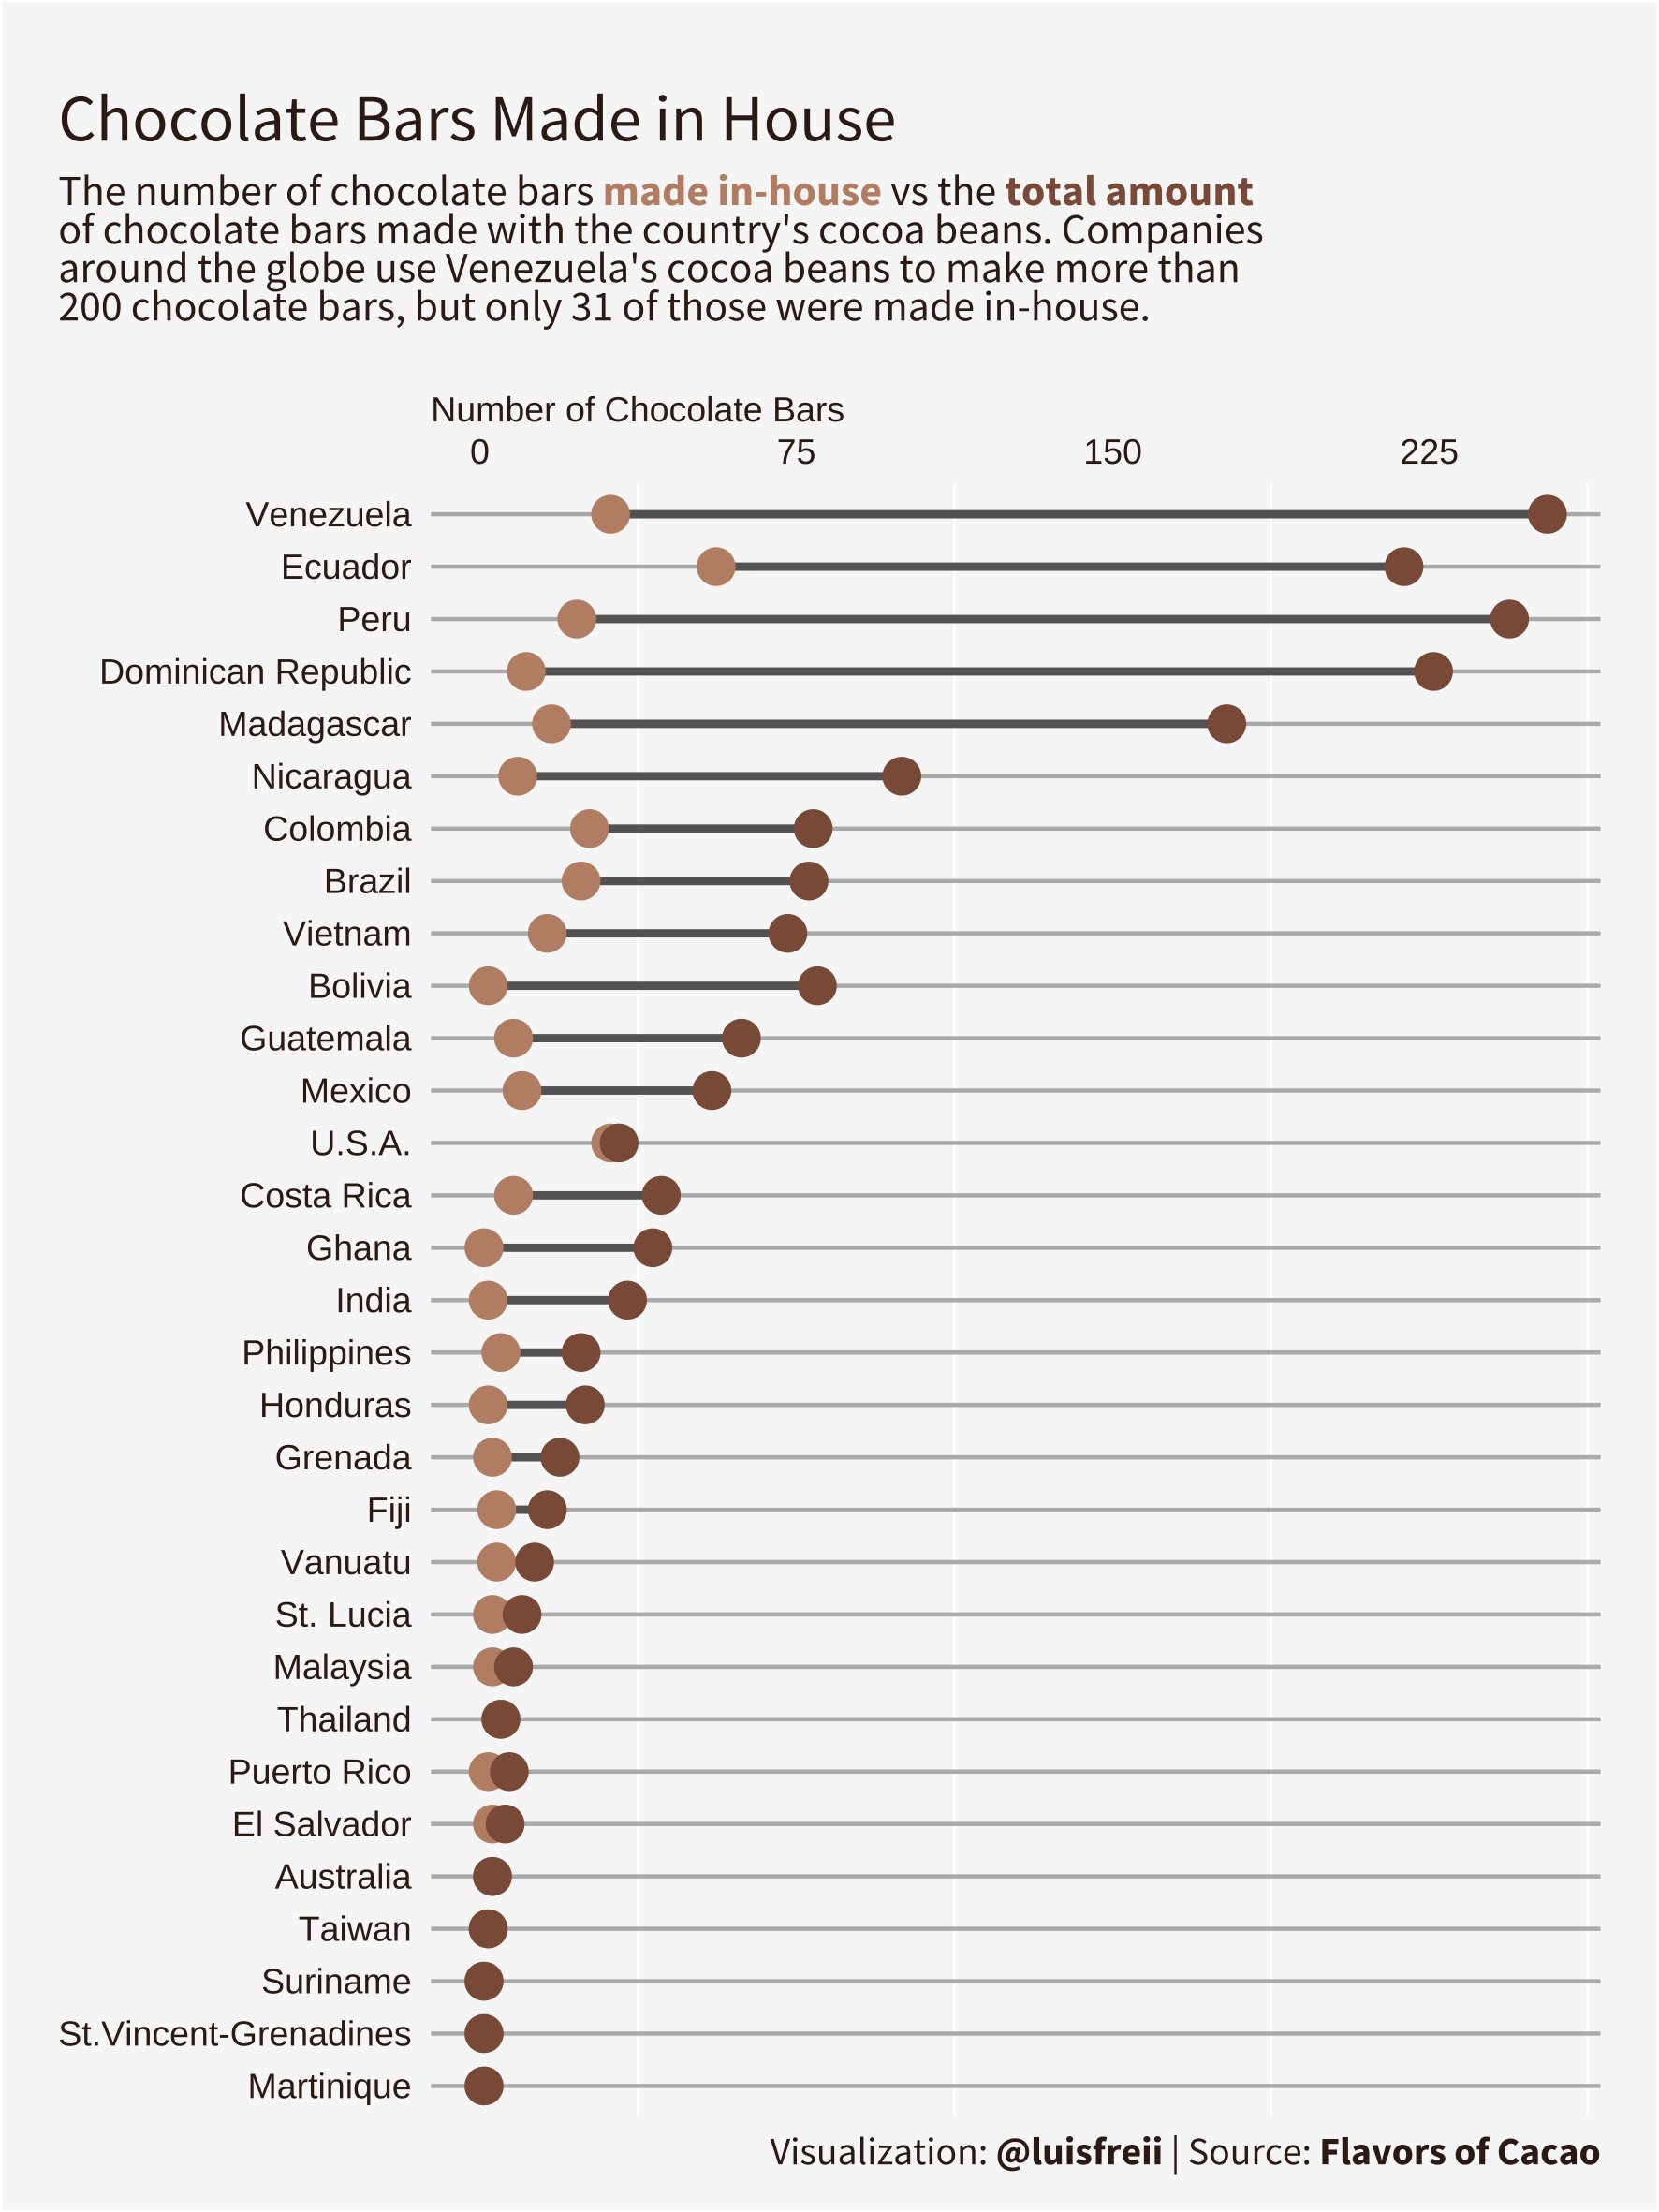
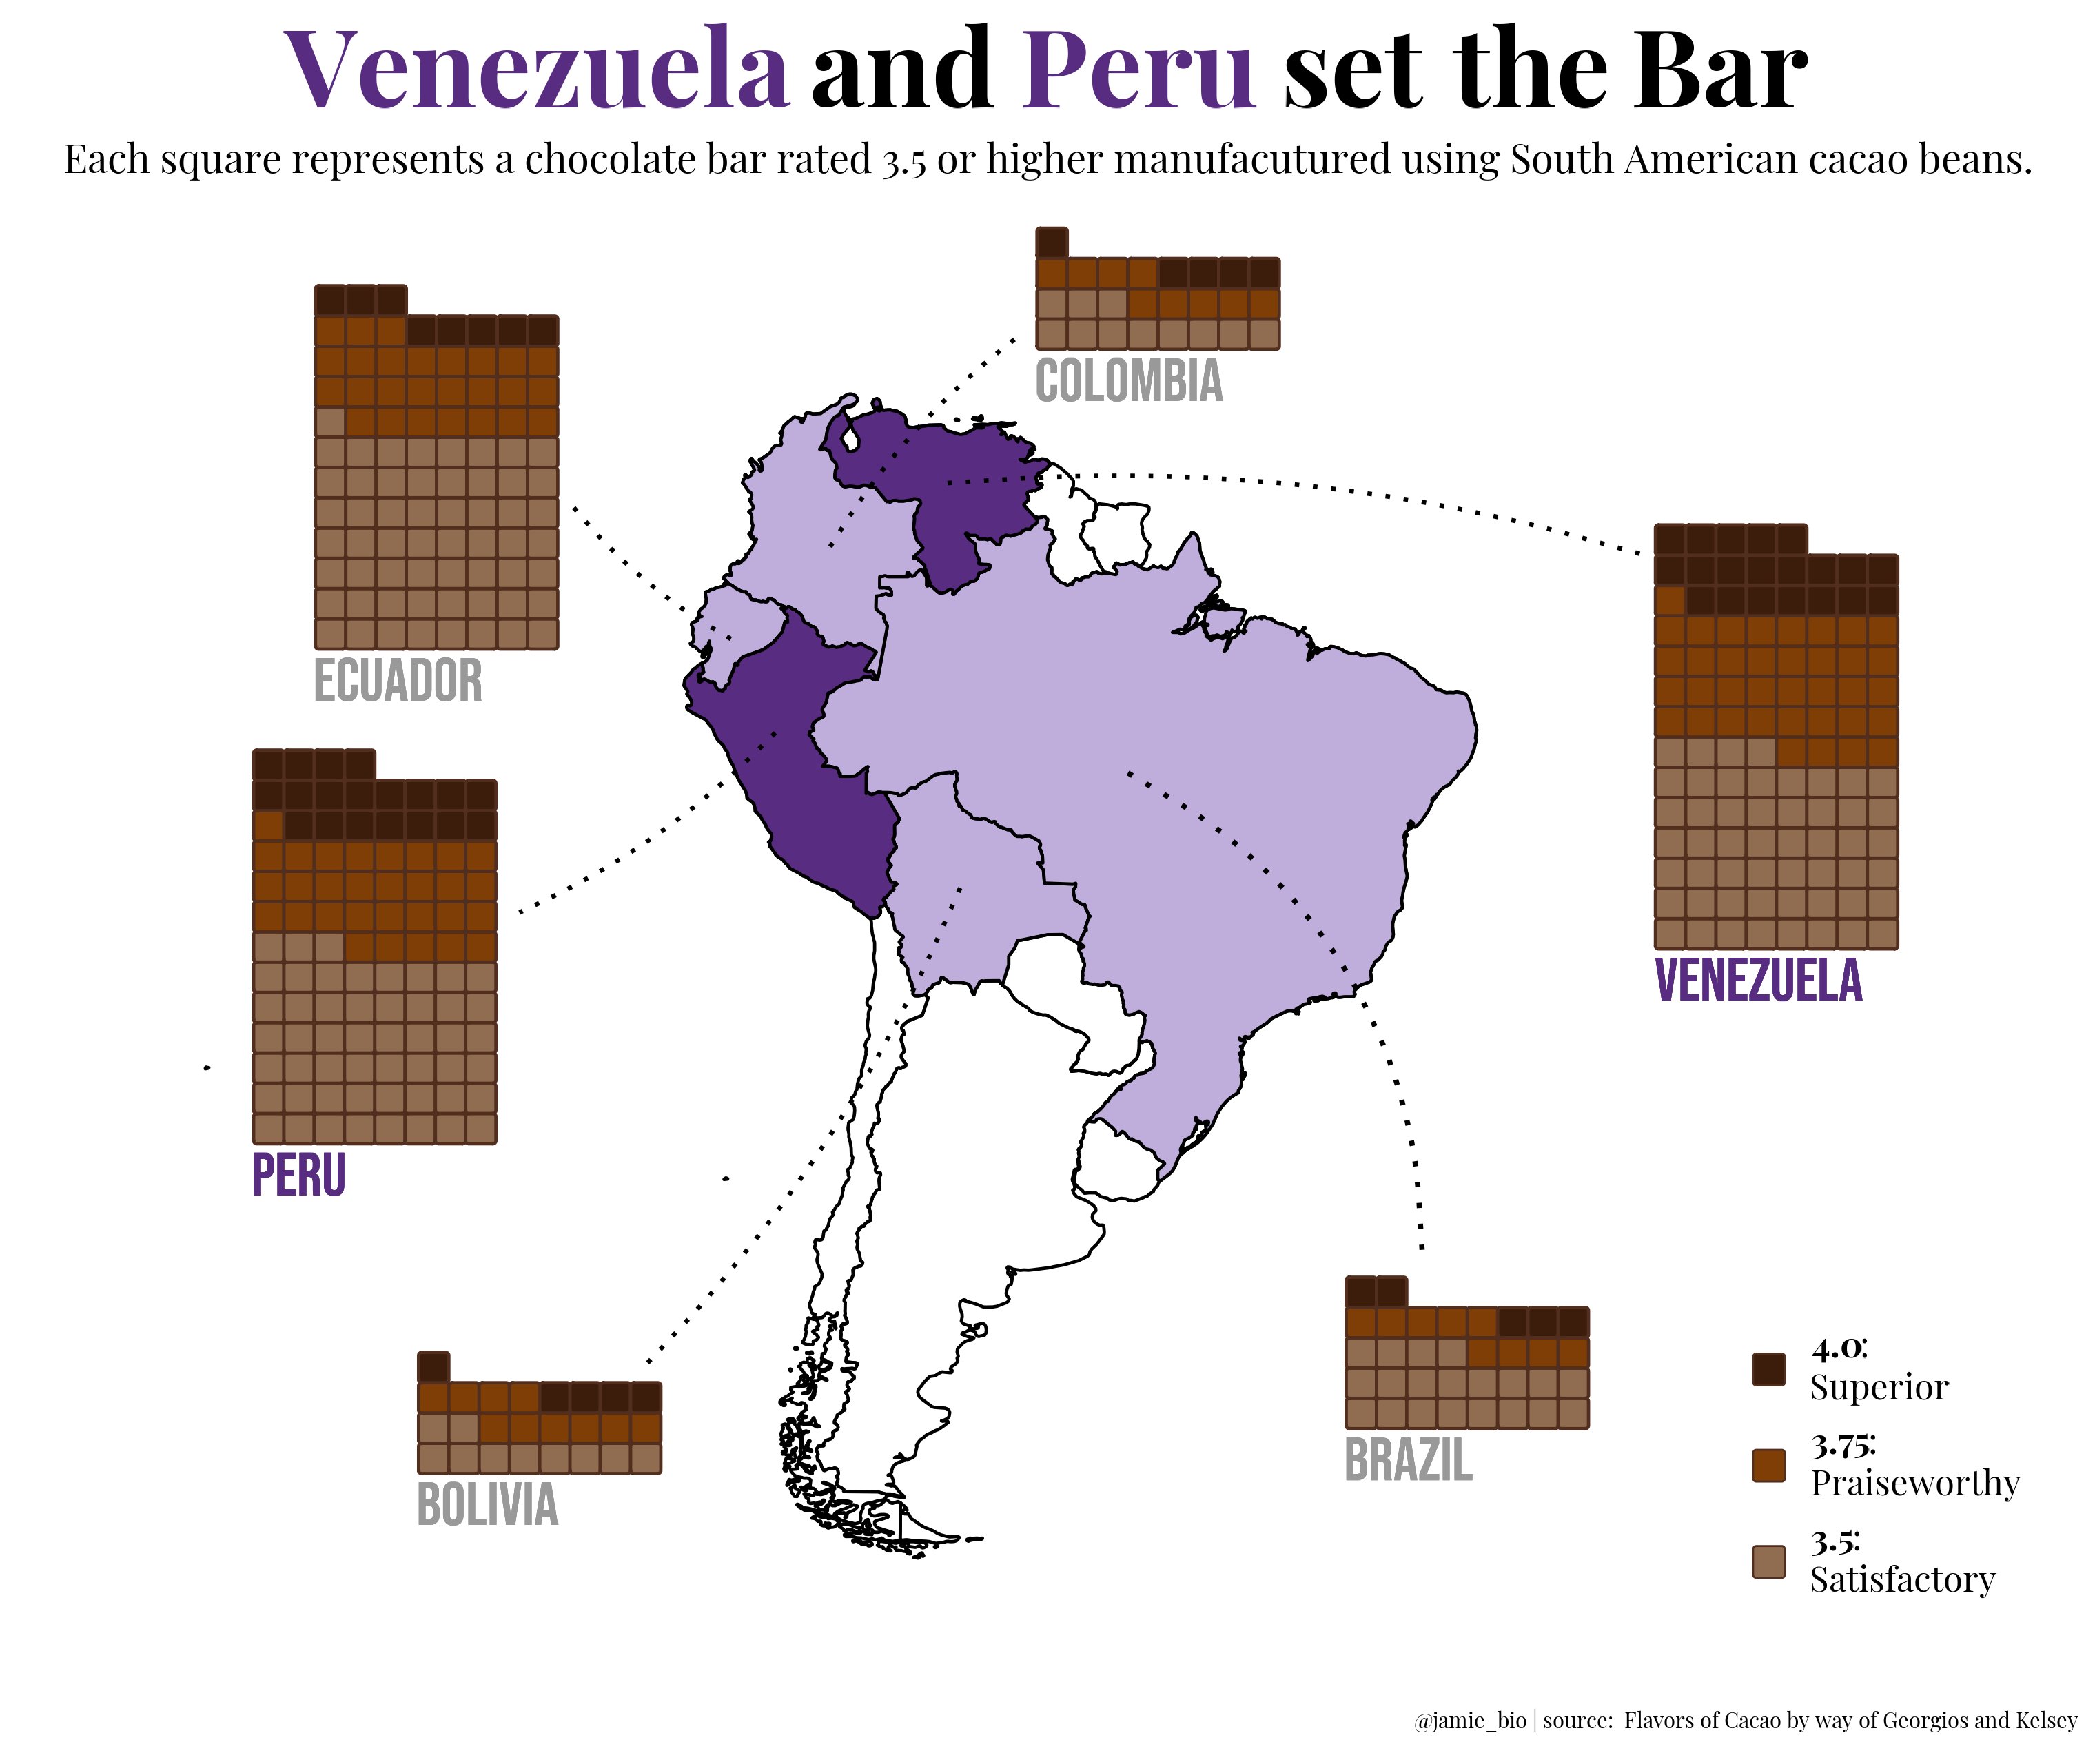
See next slides for examples of plots with the chocolate data.

Recreate the plot!

Plot 1 - using {ggalluvial}

Link to twitter post

Link to code

Plot 2 - using {ggridges}

Link to twitter post

Link to code

Plot 3

Link to twitter post

Link to code

Plot 4 - using {waffle}

Link to twitter

Link to code

Get the chocolate data like this:

chocolate <- readr::read_csv('https://raw.githubusercontent.com/rfordatascience/tidytuesday/master/data/2022/2022-01-18/chocolate.csv')