An intro to Purrr
A problem
Let’s say you want to compute the slope coefficient for each linear model in this plot. How could you do this?
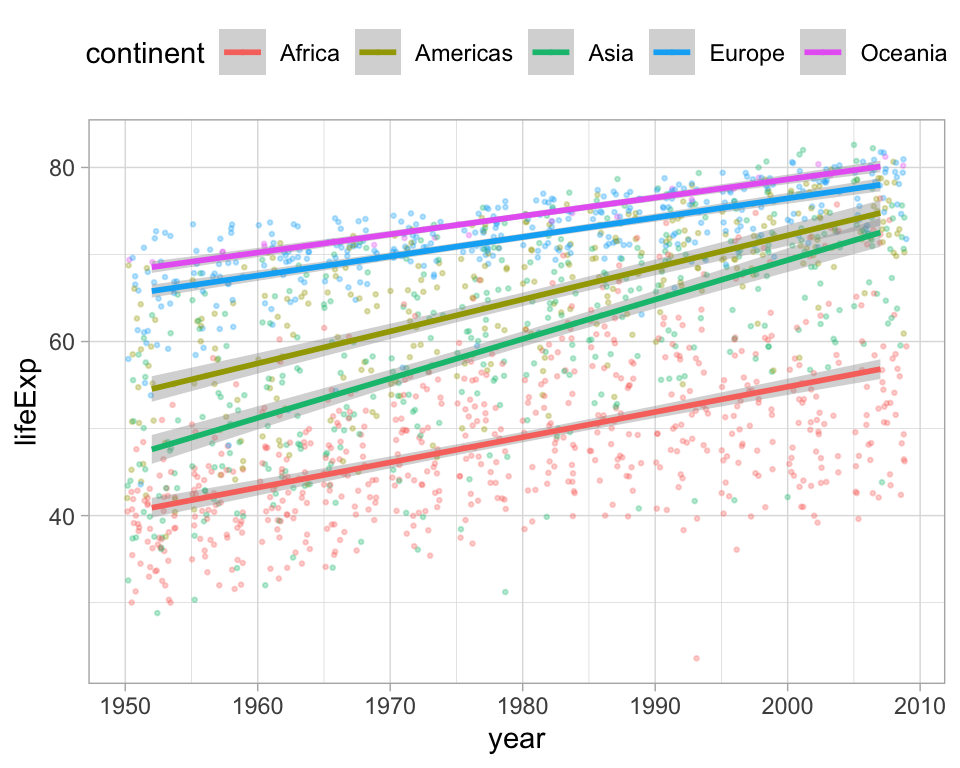
Inspired by Albert Rapp: https://yards.albert-rapp.de/lm-with-lists.html?q=purrr#lm-with-lists
A first idea
 (Intercept)         year
-524.2578461 0.2895293 But this is tedious and repeats a lot of code!
Enter the for loop
Enter the for loop
# split dataframe into a list of dataframes based on the continent
continent_list <- dat %>%
  split.data.frame(dat$continent)
# create empty list to store results in
coefficient_list <- list()
# do the loop de loop
for (continent in seq_along(continent_list)){
model <- lm(lifeExp ~ year, data = continent_list[[continent]])
coefficient_list[[continent]] <- coefficients(model)[[2]]
}Enter the for loop
# split dataframe into a list of dataframes based on the continent
continent_list <- dat %>%
  split.data.frame(dat$continent)

# create empty list to store results in
coefficient_list <- list()

# do the loop de loop
for (continent in seq_along(continent_list)){
  model <- lm(lifeExp ~ year, data = continent_list[[continent]])

  coefficient_list[[continent]] <- coefficients(model)[[2]]
}
# et voila
coefficient_list[[1]]
[1] 0.2895293
[[2]]
[1] 0.3676509
[[3]]
[1] 0.4531224
[[4]]
[1] 0.2219321
[[5]]
[1] 0.2102724Quick aside: the for loop
For loops have a bad reputation in R. That’s a bit unfair.
For loops are great, and sometimes they are the best tool to use to make your code easy to write, understand, and execute.
But sometimes they can be tricky to write, understand, debug, and slow to execute.
Maybe you don’t need to write that for loop - use purrr::map instead
Purrr basics
the map() function is actually a for loop*:
A basic example
[[1]]
[1] 3

[[2]]
[1] 6

[[3]]
[1] 9
Additional function arguments are passed along with the … syntax
You don’t always need to define a function
Any of these ways are fine. Personally, I like the shorthand version best. Note that this way to write anonymous functions is quite new. On stackoverflow, or chatGPT, you will likely get a lot of ~ notation.
A slightly more complicated example: mapping over two attributes
map_ variants
map() always returns a list, which is the most generic data structure in R. Almost anything can be saved in a list. But sometimes, we want something else.
That’s what map_lgl(), map_dbl(), map_dfr(), map_chr(), … are here for (see also ?map documentation).
Back to our problem
Exercise: How would you do it?
Back to our problem
Here’s one idea:
A final way: all in one go!
The previous idea was nice, but you still need to create a list of dataframes at the start (continent_list). This is not always desired, and sometimes it would be great to keep things all in one place (data, models, coefficients).
Here’s where you can use the nest() function :)
A final way: all in one go!
The previous idea was nice, but you still need to create a list of dataframes at the start (continent list). This is not always desired, and sometimes it would be great to keep things all in one place (data, models, coefficients).
Here’s where you can use the nest() function :)
A final final way
A final final way
models %>%
  filter(term == "year") %>%
  ggplot(aes(estimate, continent, xmin = conf.low, xmax = conf.high)) +
  geom_pointrange() +
  geom_vline(xintercept = 0, lty = 2) +
  expand_limits(x = 0) +
  theme_light() +
  labs(title = "Coefficient estimates for \"life expectancy ~ year\" for each continent",
       y = "")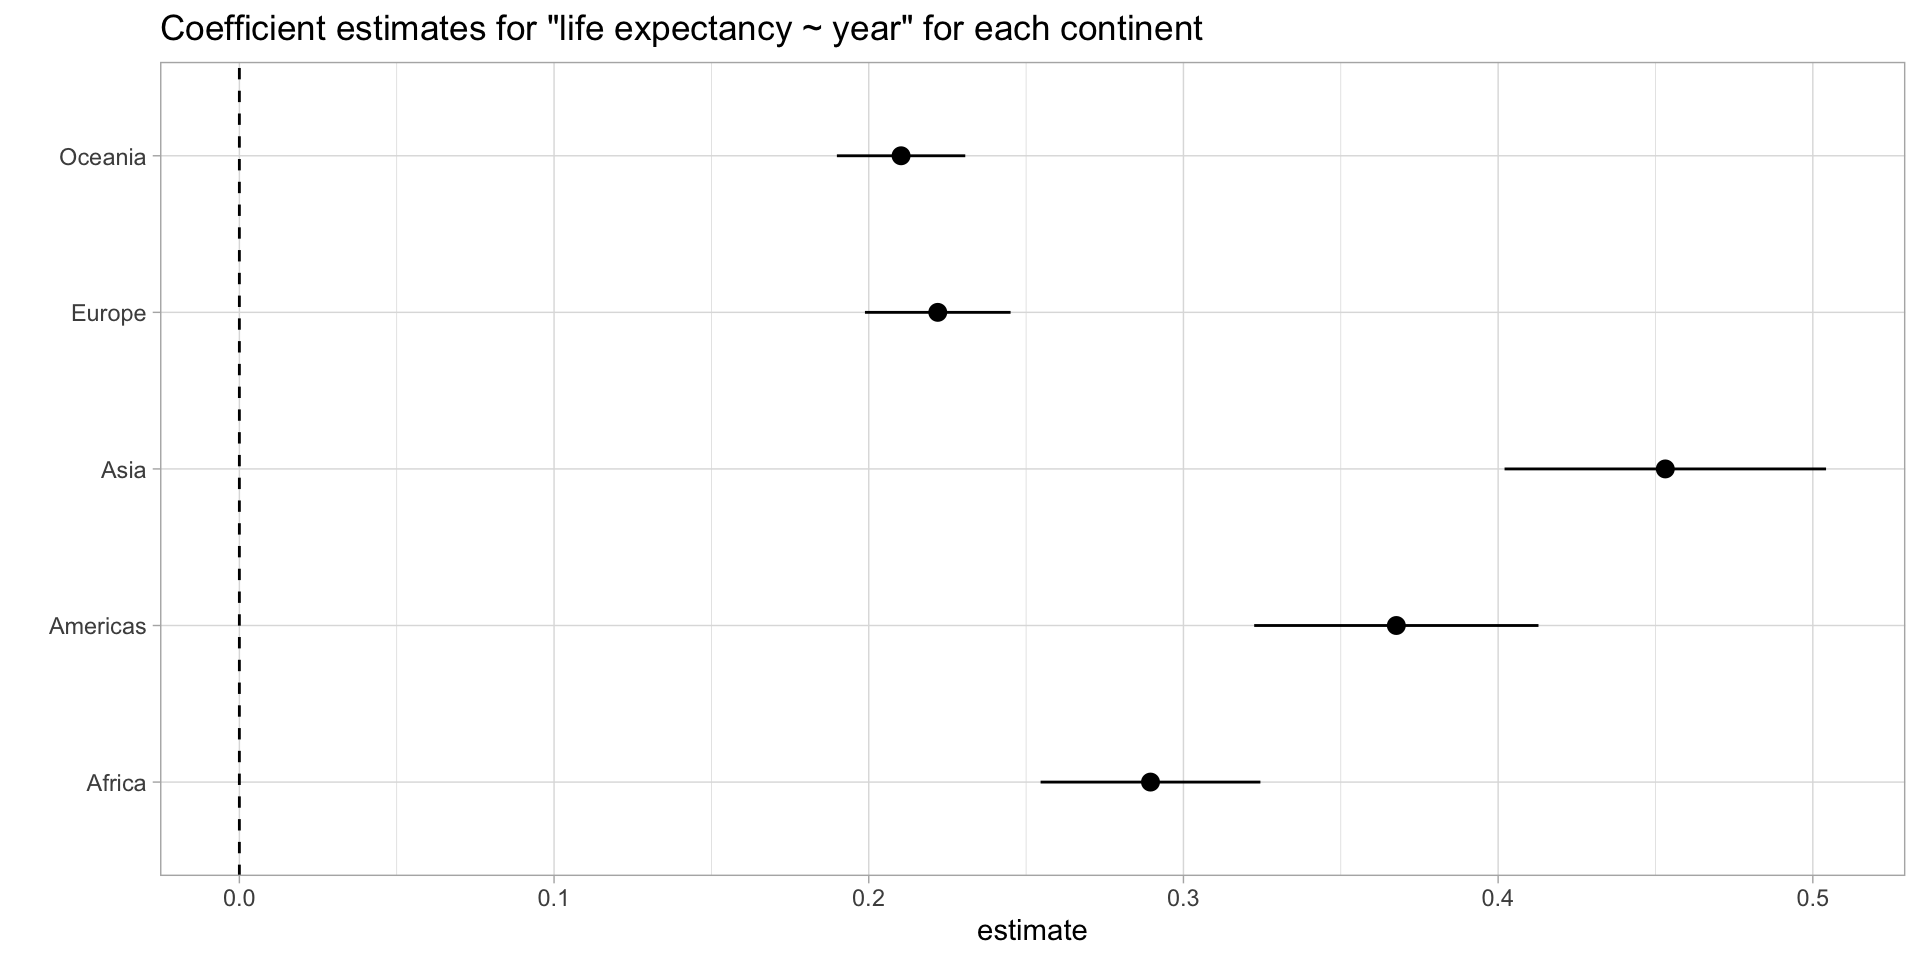
Resources
Jenny Bryan’s talk: Thinking inside the box
This package that turns purrr functions into for loops