Solution for practice: principles behind programming
── Attaching core tidyverse packages ──────────────────────── tidyverse 2.0.0 ──
✔ dplyr     1.1.2     ✔ readr     2.1.4
✔ forcats   1.0.0     ✔ stringr   1.5.0
✔ ggplot2   3.4.2     ✔ tibble    3.2.1
✔ lubridate 1.9.2     ✔ tidyr     1.3.0
✔ purrr     1.0.1
── Conflicts ────────────────────────────────────────── tidyverse_conflicts() ──
✖ dplyr::filter() masks stats::filter()
✖ dplyr::lag()    masks stats::lag()
ℹ Use the conflicted package (<http://conflicted.r-lib.org/>) to force all conflicts to become errors
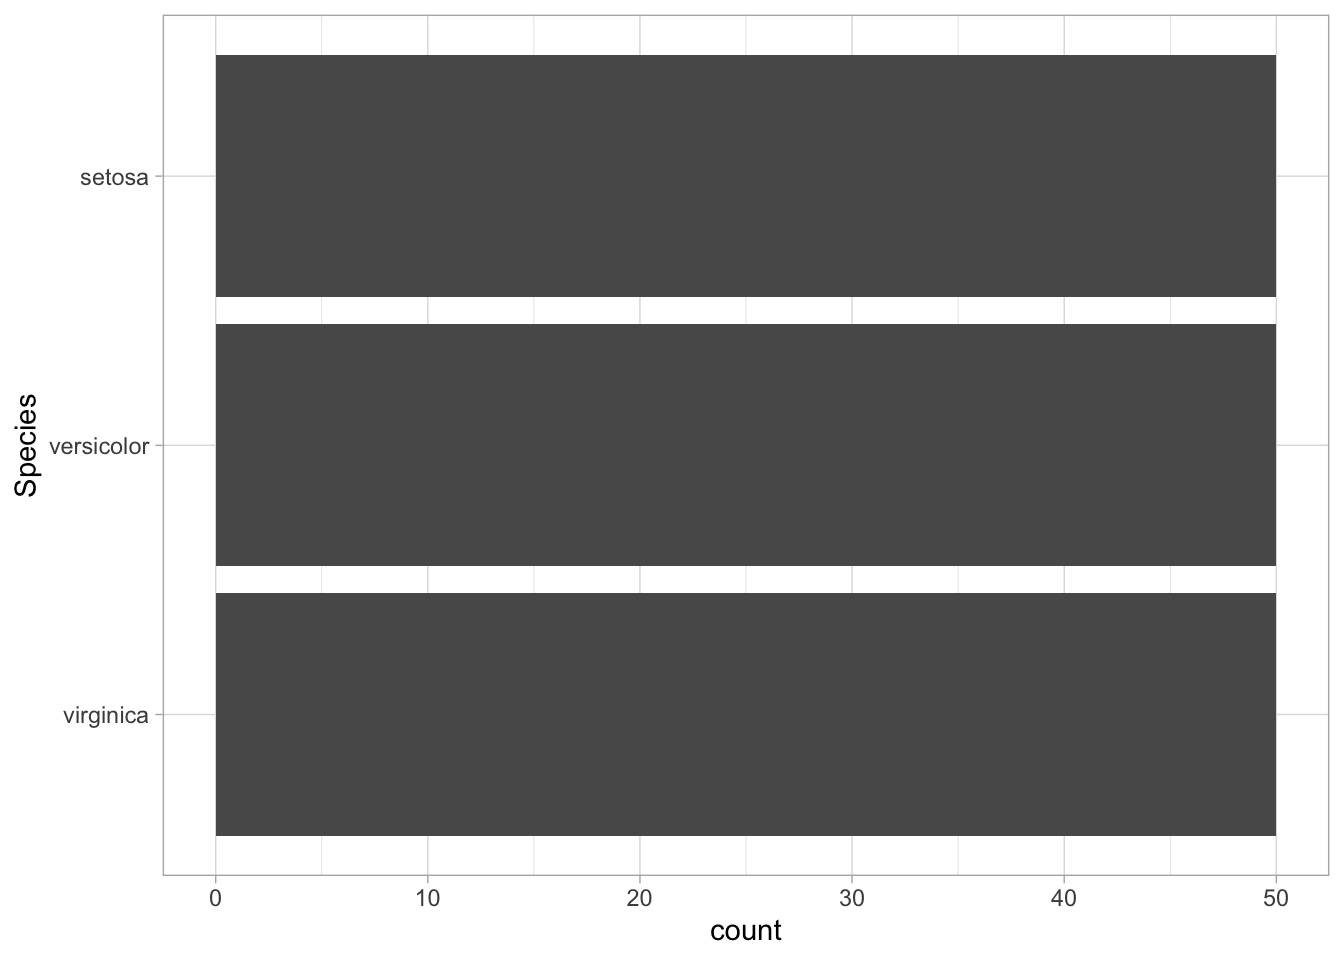
- Create a create_barchart() function that plots a bar chart of a given variable.
Bonus: make it so that bars are sorted by size (tip: use a function from the fct_ family)
create_barplot <- function(data, variable_to_plot){
  data %>%
    mutate({{variable_to_plot}} := fct_rev(fct_infreq({{variable_to_plot}}))) %>%
    ggplot(aes(y = {{variable_to_plot}})) +
    geom_bar() +
    theme_light()
}

create_barplot(iris, Species)
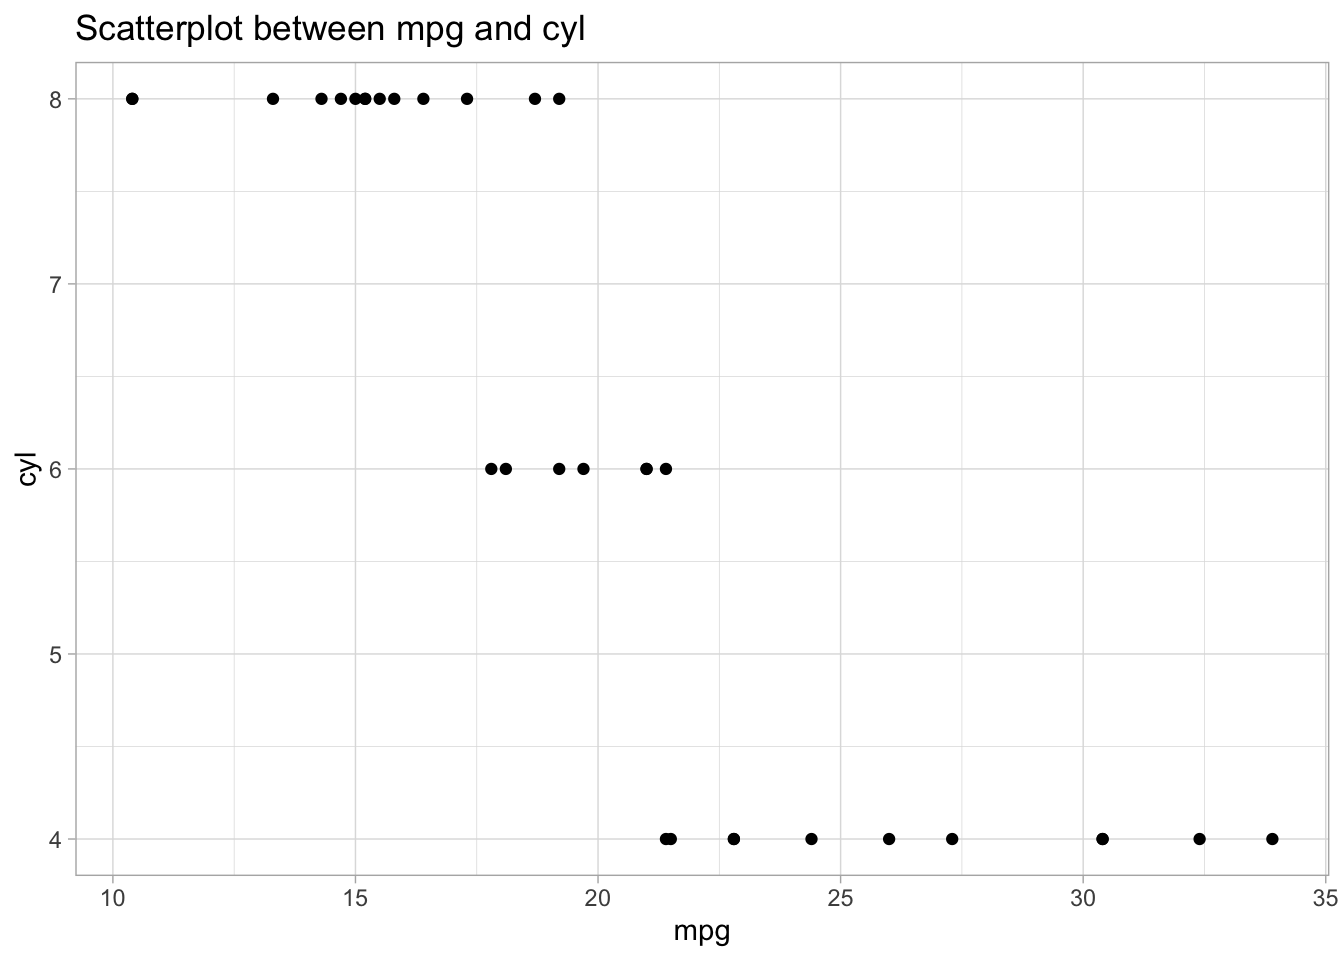
- Change the create_scatterplot() function so that it has a title that describes which variables are plotted.
Tip: this requires treating the name of the objects as a string. Perhaps a quick google search can help you.
create_scatter_plot <- function(data, variable1, variable2) {
  variable_name1 <- ensym(variable1)
  variable_name2 <- ensym(variable2)

  data %>%
    ggplot(aes({{variable1}}, {{variable2}})) +
    geom_point() +
    theme_light() +
    labs(title = glue("Scatterplot between {variable_name1} and {variable_name2}"))
}
create_scatter_plot(mtcars, mpg, cyl)